Jason Perz Analyst/Trader Against All Odds Research JasonP138 Futures-Commodities, currencies, bonds, crypto, sectors. Interviews with traders
Hosted Shows Supercycle Stocks Live Airs: Thursdays @ 2:00 PM ET Recent Guest Appearances The Morning Show - March 16, 2026 March 16, 2026 Hosted by Spencer Israel JC Parets Steve Strazza With special guest(s) Kenny Glick Michael Batnick Jason Perz The Morning Show - March 4, 2026 March 4, 2026 Hosted by Spencer Israel JC Parets Steve Strazza With special guest(s) Kenny Glick Brian Lund Jason Perz The Morning Show for February 23 February 23, 2026 Hosted by Spencer Israel JC Parets Steve Strazza With special guest(s) Kenny Glick Stephen Weitzel Jason Perz Clone of Why Is Silver Crashing? 🚨Get All Of Strazza's Earnings Season Trades When You Join The Beat Report🚨 February 5, 2026 With special guest(s) Spencer Israel Jason Perz Hot, Fresh, Monthly Candles February 2, 2026 Hosted by Spencer Israel JC Parets Steve Strazza With special guest(s) Kenny Glick Jason Perz Recent Articles Sam Gatlin Jason Perz A Transition in Commodity Leadership Gold’s relative dominance is fading as energy and other sectors begin to take control. Over the past two years, the story in commodities has been pretty straightforward.Precious metals have been the clear leaders.Ever since Gold broke out on March 4, 2024, the entire complex has been dominated by strength in Gold, Silver,... March 23, 2026 All Star Charts Premium Supercycle Report Precious Metals Video Gold Rush Members Only Sam Gatlin Jason Perz Passing the Baton Metals led the charge, but now agriculture is taking over. We’ve been pounding the table on this idea for months now.This isn’t just a commodity bull market… It’s a ... March 20, 2026 All Star Charts Premium Supercycle Report Commodities Weekly Members Only Sam Gatlin Jason Perz Dollar vs. Metals The battle at DXY 100 will decide whether precious metal miners rip higher or roll over. Right now, all eyes are on the US Dollar. Point blank, period.If you missed Rick's... March 16, 2026 Supercycle Report All Star Charts Premium Precious Metals Video Gold Rush Members Only
The Morning Show - March 16, 2026 March 16, 2026 Hosted by Spencer Israel JC Parets Steve Strazza With special guest(s) Kenny Glick Michael Batnick Jason Perz
The Morning Show - March 4, 2026 March 4, 2026 Hosted by Spencer Israel JC Parets Steve Strazza With special guest(s) Kenny Glick Brian Lund Jason Perz
The Morning Show for February 23 February 23, 2026 Hosted by Spencer Israel JC Parets Steve Strazza With special guest(s) Kenny Glick Stephen Weitzel Jason Perz
Clone of Why Is Silver Crashing? 🚨Get All Of Strazza's Earnings Season Trades When You Join The Beat Report🚨 February 5, 2026 With special guest(s) Spencer Israel Jason Perz
Hot, Fresh, Monthly Candles February 2, 2026 Hosted by Spencer Israel JC Parets Steve Strazza With special guest(s) Kenny Glick Jason Perz
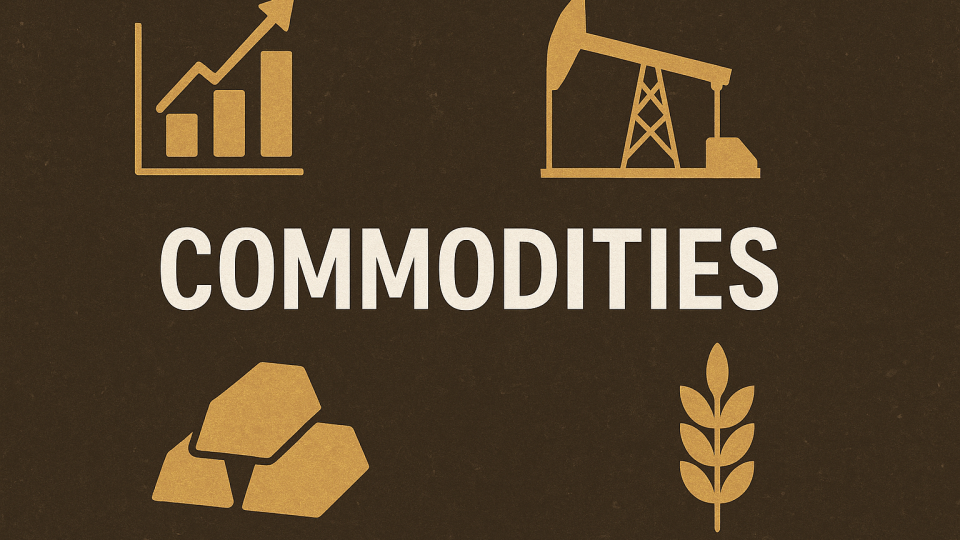
Sam Gatlin Jason Perz A Transition in Commodity Leadership Gold’s relative dominance is fading as energy and other sectors begin to take control. Over the past two years, the story in commodities has been pretty straightforward.Precious metals have been the clear leaders.Ever since Gold broke out on March 4, 2024, the entire complex has been dominated by strength in Gold, Silver,... March 23, 2026 All Star Charts Premium Supercycle Report Precious Metals Video Gold Rush Members Only
Sam Gatlin Jason Perz Passing the Baton Metals led the charge, but now agriculture is taking over. We’ve been pounding the table on this idea for months now.This isn’t just a commodity bull market… It’s a ... March 20, 2026 All Star Charts Premium Supercycle Report Commodities Weekly Members Only
Sam Gatlin Jason Perz Dollar vs. Metals The battle at DXY 100 will decide whether precious metal miners rip higher or roll over. Right now, all eyes are on the US Dollar. Point blank, period.If you missed Rick's... March 16, 2026 Supercycle Report All Star Charts Premium Precious Metals Video Gold Rush Members Only